UK Statistics Games
19 December 2021
We have seen a lot of media and politicians make claims regarding the numbers of unvaccinated in hospital allegedly with COVID-19. According to the Evening Standard, the current UK Health Minister Sajid Javid “slams anti-vaxxers taking up hospital beds” and claimed “around nine out of 10 of those needing the most care in hospital were unvaccinated”.
There are a number of issues with those inflammatory and aggressive headlines and statements. Obviously the label “anti-vaxxers” is just fanatical and used to incite anger and hatred of anyone who hasn’t yet had their jabs, for any reason whatsoever. The second statement is a carefully crafted piece of wordplay that on the face of it implies 9 out of 10 seriously ill COVID patients in hospital are “unvaccinated”, although it doesn’t actually say it. Given that the term “unvaccinated” has become the most redefined word in history in the last 12 months, it also is extremely vague. Whenever you hear a politician making an aggressive statement that is dutifully repeated ad nauseum by the media that is also vague, you can be fairly certain it’s a lie. We will prove it is a lie a bit later on.
He also claims that those not getting their jabs are causing “damage to society” because “they take up hospital beds that could have been used for someone with maybe a heart problem, or maybe someone who is waiting for elective surgery”. Never mind that the Government has already decided to halt pretty much everything in the NHS including “elective surgery” to push their “Get Boosted Now” onto everyone by the end of the year. The Government and NHS is the cause of people not getting seen by doctors or having operations, not the “10% of the eligible population”.
Who is this group then? This selfish, society damaging “10%”, who are they? Well according to the Government that is likely to be made up of mostly children under 16, as according to a graph in the UK Health Security Agency (HSA) “COVID-19 vaccine surveillance report week 50” (link/mirror) that is the only demographic that isn’t between 60-95% “cumulative uptake”. Sajid Javid is directing vitriol and hatred inciting propaganda at mostly children. It should not require any further explanation as to how despicable that is.
To add to the questioning of Javid’s motives, just a few days earlier on the 13th December 2021 it was reported on Yahoo News (amongst other outlets) that “Sajid Javid Confirms ‘About 10’ People Are In The Hospital With Omicron In England”.
Looking at the HSA document, as we have looked at earlier ones, the trouble with the “official” figures is they are categorised and stratified in such a way as to make them next to useless. Of course that doesn’t stop the media and politicians running their mouths, and outright lying on occasions (9/10 unjabbed in hospitals being a lie).
Starting on page 35 of this Government document is where you’ll find the data on jab status and cases/hospital admissions/deaths. When you look at table 8 which is “COVID-19 cases by vaccination status between week 46 and week 49 2021” you’ll see the problem…
The vast majority of “cases” are in the under 18s, i.e. schoolkids and the vast majority of them are (thankfully) unjabbed, although Sajid is clearly angry about it and wants the nation to be angry about it too. Let’s look at this table…
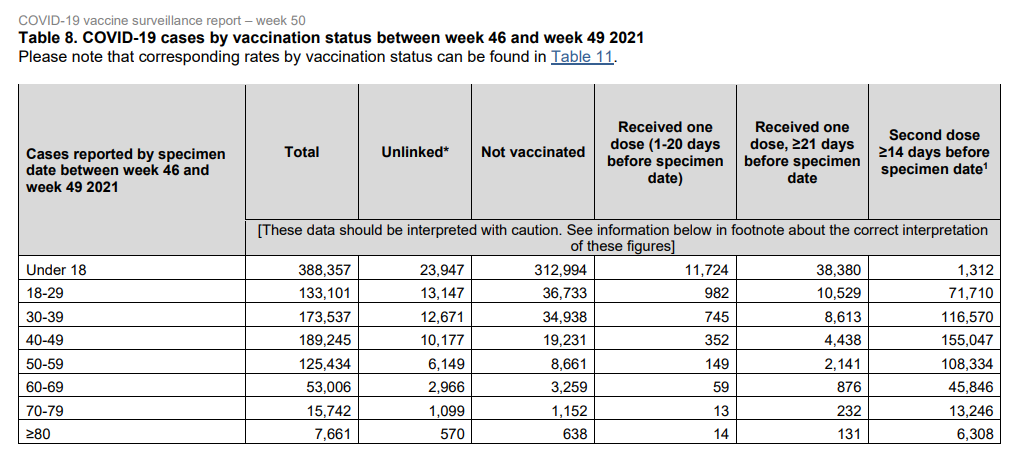
Looking at totals for “cases”, “not vaccinated” and “second dose ≥14 days before specimen date” (i.e. “fully vaccinated” as per today’s definition) we get 3 numbers…
Cases: 1,086,083
Not vaccinated: 417,606
Fully vaccinated: 518,373
For visual reference those numbers look like this:
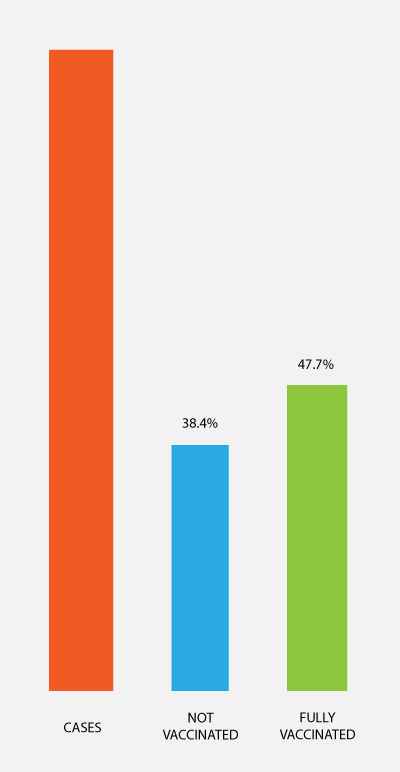
That’s the “not vaccinated” group making up 38.4% of cases and the “fully vaccinated” making up 47.7%. But those numbers are skewed as they are based on all ages, and the under 18s are disproportionately represented in the “not vaccinated” category. The reason for this is obvious; it has only been a recent push by the Government to demand those in that age group to get jabbed, and many under 12s of course as yet are not “eligible” at all. If we take out the under 18s numbers things look very different…
Cases: 697,726
Not vaccinated: 104,612
Fully vaccinated: 517,061
Again to visualise those numbers see this graph…
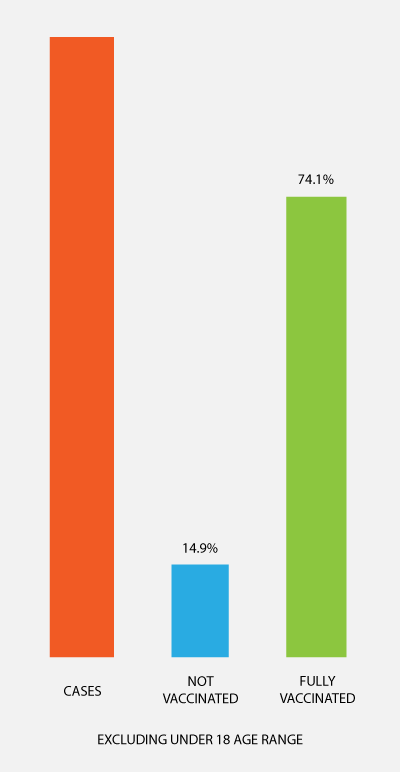
Now the “not vaccinated” group makes up just 14.9% of cases, and the “fully vaccinated” make up 74.1% of cases. These numbers are still unreliable for all sorts of other reasons, but you can see that the inclusion of an age-range that contains mostly ineligible children and those with the shortest amount of time to have had their jabs distorts the figures massively, not to mention the age range that has been almost entirely unaffected even by official figures.
Table 9 in the document is where the wordplay and classification trickery gets going. Table 9 is titled “COVID-19 cases presenting to emergency care (within 28 days of a positive specimen) resulting in an overnight inpatient admission by vaccination status between week 46 and week 49 2021” and so because of that these numbers are completely meaningless. These are listed as “COVID-19 cases” because they tested “positive” with the previous 28 days, but this does not necessarily mean that is why they were admitted. This is not my interpretation but the footnote explains:
Individuals in risk groups may also be more at risk of hospitalisation or death due to non-COVID-19 causes, and thus may be hospitalised or die with COVID-19 rather than because of COVID-19.
Page 36 – https://assets.publishing.service.gov.uk/government/uploads/system/uploads/attachment_data/file/1041593/Vaccine-surveillance-report-week-50.pdf
As there is no way to know from these figures who the high-risk groups are other than the obvious age-related risks with all respiratory ailments, these numbers are as good as junk.
The same really goes for table 10, but these are the “official” figures and therefore should be able to back up the claims by the Government and media. Looking at Table 10 which is titled… “COVID-19 deaths (a) within 28 days and (b) within 60 days of positive specimen or with COVID-19 reported on death certificate, by vaccination status between week 46 and week 49 2021” is interesting. We shall look at Table 10b (deaths within 60 days) as it should include everything from Table 10a (deaths within 28 days)…
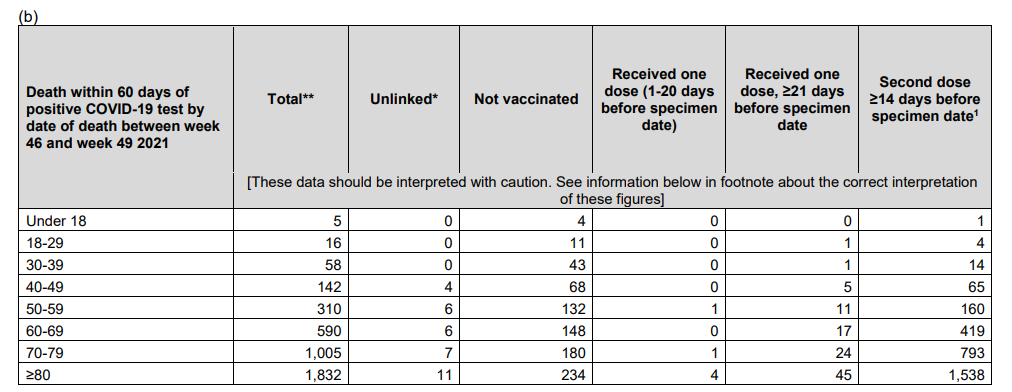
Totals here are:
Deaths: 3,958
Not vaccinated: 820
Fully vaccinated: 2,994
That translates to the “not vaccinated” group making up 20.7% of “deaths within 60 days of a positive COVID-19 test”, and the “fully vaccinated” being 75.6% of those deaths.
Here is a graph to visualise that…
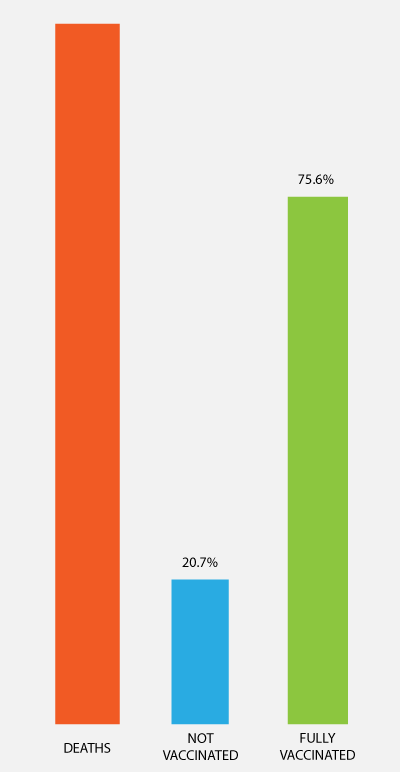
Not even close to being anything like how this is being reported. Again it should be stated that deaths within X days of a “positive test” is not the same as dying from, but these are official Government figures and the politicians and media that are spouting figures like 9/10 people dying or in ICU with COVID-19 are “unvaccinated” are complete liars.
The reality is the “unvaccinated” are 2 in 10 that are dying within 60 days of a “positive” test, and that could be a PCR test that “does not distinguish between infectious and non-infectious virus”, or the even more unreliable lateral-flow test.
According to the week 50 “Weekly national Influenza and COVID-19 surveillance report” from the UK Health Security Agency published on the Government website:
COVID-19 vaccine coverage for all ages was 67.9% for dose 1 at the end of week 49. COVID19 vaccine coverage was 62.2% for dose 2 at the end of week 49, reaching over 90% in all cohorts over the age of 65 years. COVID-19 vaccine coverage for all ages for dose 3 was at 31.4% at the end of week 49, reaching over 80% in all cohorts over the age of 70.
Page 4 – https://assets.publishing.service.gov.uk/government/uploads/system/uploads/attachment_data/file/1041447/Weekly_Flu_and_COVID-19_report_w50.pdf
No claim is being made here about what is causing deaths. Looking at the data from the Government and their Agencies shows that while the “unvaccinated” make up 20.7% of deaths being attributed to COVID-19 they make up 32.1% of the population. The thing that adds to the complexity is that these numbers include all ages, and we do know that the elderly are more susceptible to illness that regrettably sometimes leads to death. They are over-represented in the figures which evidences what we all know. The issue is that it is being claimed that these so-called vaccines are around “90 to 100%” effective, and that everyone including children should have them, and if you don’t you’re a selfish, society-damaging anti-vaxxer that will clog up NHS beds. That is demonstrably false by every metric and exists only in the minds of deluded, ranting politicians and media mouthpieces and members of the public that have simply believed the lies.
Even if we look at just the over 70s who are most at risk from any and all health issues generally, according to that report above over 80% of over 70s have had three doses, and yet the “unvaccinated” make up only 14.5% of the deaths attributed to COVID-19 in Table 10b we looked at earlier. Again no claim is being made to say what these people are sadly dying from. The point here is if the jabs work, you would reasonably expect the proportion of deaths to be higher in the “unvaccinated”, especially if the jabs are anything like 90% effective in preventing death. We don’t see that though, not across all ages or even just looking at the data for the very group this was originally claimed to protect.
The Government and media is lying, just like they have lied throughout this entire scam. The evidence is clear.